| Overall | 16W 6L 2T |
| District | 6W 0L 0T |
| Expected | 16: 3+ 5- |
":" = Games won or lost as expected,
"+" = Games won against stronger team,
"-" = Games lost against weaker team)
|
14 2 1 Rank in State, Class, District |
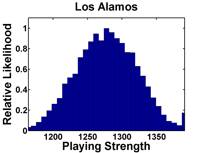
1278 140 Strength Momentum |
1114 58.7(15) SOS, RPI(RPI Rank) |
":" = Games won or lost as expected, "+" = Games won against stronger team, "-" = Games lost against weaker team) | |
| Date | Opponent1 | RGWF4 | Opp Strength | Result | Expectation2 | Playing Strength | P(Win)3 | Send |
|---|---|---|---|---|---|---|---|---|
| 08/22/15 | Farmington ?? | 0.000 | 1220 | L 1- 3 | Worse (-3) | 1137 | 60% |  |
| 08/25/15 | at Bosque | 0.000 | 1185 | T 1- 1 | Worse (-1) | 1243 | 59% | |
| 08/27/15 | Moriarty | 0.000 | 458 | W 10- 0 | Expected (+2) | 1376 | 98% | |
| 09/01/15 | St. Pius | 0.001 | 1289 | L 0- 2 | Worse (-2) | 1172 | 52% | |
| 09/10/15 | at Hope Christian | 0.003 | 1392 | L 0- 5 | Expected (-4) | 1094 | 34% | |
| 09/11/15 | Mayfield !! | 0.006 | 1360 | W 2- 0 | Better (+3) | 1408 | 43% | |
| 09/12/15 | at Carlsbad | 0.007 | 1258 | W 1- 0 | Better (+1) | 1330 | 49% | |
| 09/15/15 | Albuquerque Academy ? | 0.010 | 1268 | L 0- 2 | Worse (-2) | 1161 | 54% | |
| 09/17/15 | at Rio Rancho | 0.016 | 1444 | L 0- 2 | Expected (0) | 1273 | 29% | |
| 09/22/15 | at Capital | 0.017 | 1074 | W 5- 0 | Expected (+3) | 1440 | 70% | |
| 09/26/15 | Taos | 0.055 | 816 | W 3- 0 | Expected (-2) | 1186 | 91% | |
| 09/29/15 | Robertson | 0.047 | 615 | W 6- 0 | Expected (-1) | 1239 | 97% | |
| 10/02/15 | Highland | 0.067 | 907 | W 6- 0 | Expected (+2) | 1385 | 85% | |
| 10/03/15 | at Bernalillo | 0.107 | 958 | W 3- 0 | Expected (0) | 1280 | 80% | |
| 10/06/15 | at Del Norte | 0.147 | 895 | W 3- 0 | Expected (-1) | 1249 | 85% | |
| 10/10/15 | Capital ! | 0.149 | 1074 | W 6- 0 | Expected (+4) | 1468 | 74% | |
| 10/17/15 | Piedra Vista | 0.439 | 1001 | W 3- 0 | Expected (0) | 1279 | 81% | |
| 10/21/15 | Bernalillo | 0.608 | 958 | W 2- 0 | Expected (-1) | 1206 | 84% | |
| 10/22/15 | at St. Michael's | 0.663 | 1262 | T 2- 2 | Better (0) | 1282 | 49% | |
| 10/24/15 | Del Norte | 0.095 | 895 | W 11- 1 | Expected (+6) | 1595 | 87% | |
| 10/31/15 | Belen | 0.710 | 975 | W 4- 0 | Expected (+1) | 1316 | 82% | |
| 11/05/15 | * Aztec | 0.991 | 1155 | W 2- 1 | Expected (0) | 1255 | 64% | |
| 11/06/15 | * Farmington | 0.850 | 1220 | W 3- 1 | Expected (+2) | 1361 | 57% | |
| 11/07/15 | * St. Pius | 0.940 | 1289 | L 0- 1 | Worse (-1) | 1222 | 49% | |
|
Notes: 1Games against an opponent in the same district are shown in bold letters; may NOT be an actual district game Numbers in parentheses for reported games are the goals Los Alamos actually scored, relative to what ratings predicted 2Numbers listed for unreported/future games are the most probable winning margin 3P(Win) is the expected winning Percentage -- the statistical success rate for predicting the game winner between teams of this strength difference 4RGWF is the relative weight factor for this game * Game at a neutral site, or unable to determine which team gets home field advantage |
The median opponent strength is 1114, while
Los Alamos's "weighted playing strength" is 1284
(where a win by 4 goals counts 0.69 as much as a 1 goal win, and
a game played on 10/17/15 counts 0.5 that of one played on 11/07/15)
Go back to ratings for Boys Varsity Girls Varsity Main Page